
Figure 7.
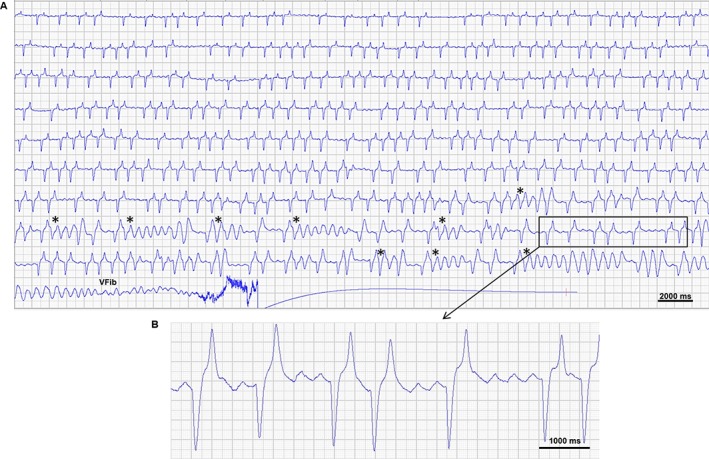
Electrocardiogram obtained during flecainide infusion resulting in cardiac arrest. The ECG (lead II) is from a horse receiving a second dose of flecainide in an attempt to cardiovert atrial fibrillation with a duration of 59 days. After several episodes of torsades‐like ventricular tachycardia with preceding short‐long‐short coupling initiation (*) the horse develops ventricular fibrillation (VFib). A) Is an overview of the last 6 min leading up to cardiac arrest and B) is a section of the ECG where distinct fibrillatory waves appear at a rate of 163/min (368 ms interval)