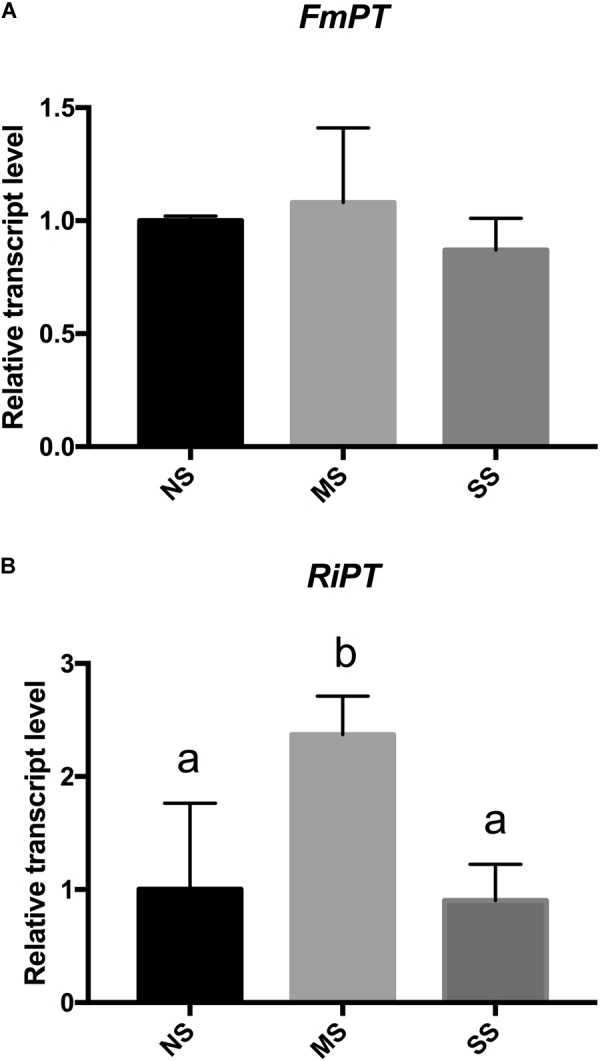
FIGURE 3.

Expression changes of fungal phosphate transporter (PT) genes in AM+ roots upon irrigation (NS), moderate water stress (MS), and severe water stress (SS) conditions. RT-qPCR analysis of (A) F. mosseae PT (FmPT) and (B) R. intraradices PT (RiPT) genes, respectively. Lower letters denotes significant differences attested by Tukey HSD test (P < 0.05). Data are expressed as mean ± SE (n = 3).
