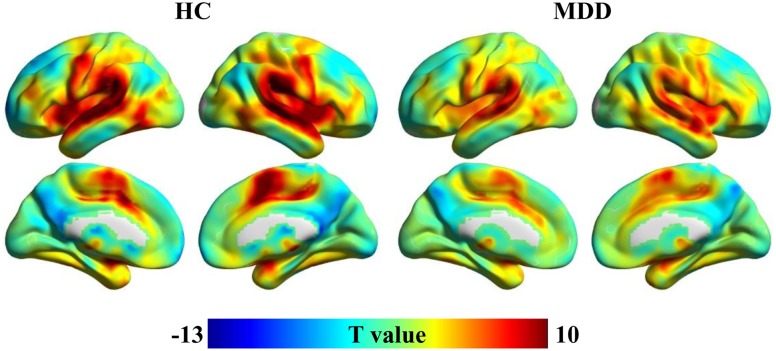
FIGURE 1.
One-sample t-tests were used to identify the distribution of weighted global brain connectivity (wGCB) in major depressive disorder (MDD) and healthy controls (HC). The high wGCB were primarily detected in the superior temporal gyrus, lateral occipital gyrus, fusiform gyrus, intraparietal sulcus, medial temporal lobe, middle cingulate cortex, caudate, medial frontal cortex, lateral prefrontal cortex, inferior frontal cortex, and insula.

