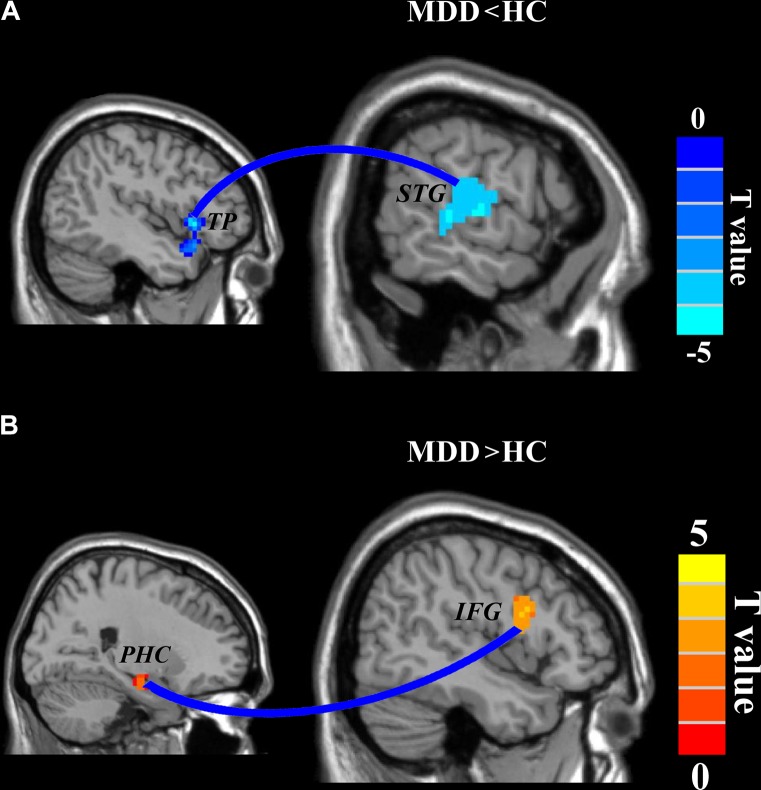
FIGURE 3.
Disrupted functional connectivities in major depressive disorder (MDD) patients. Two-sample t-tests were used to identify the significant differences in functional connectivity between MDD and healthy control groups. (A) Significantly decreased functional connectivity between left temporal pole and right superior temporal gyrus and (B) significantly increased functional connectivity between right parahippocampus and right inferior frontal gyrus were found. The significance was determined using a cluster-level Monte Carlo simulation (5000 times) corrected threshold of p < 0.05 (cluster-forming threshold at voxel-level p < 0.001).

