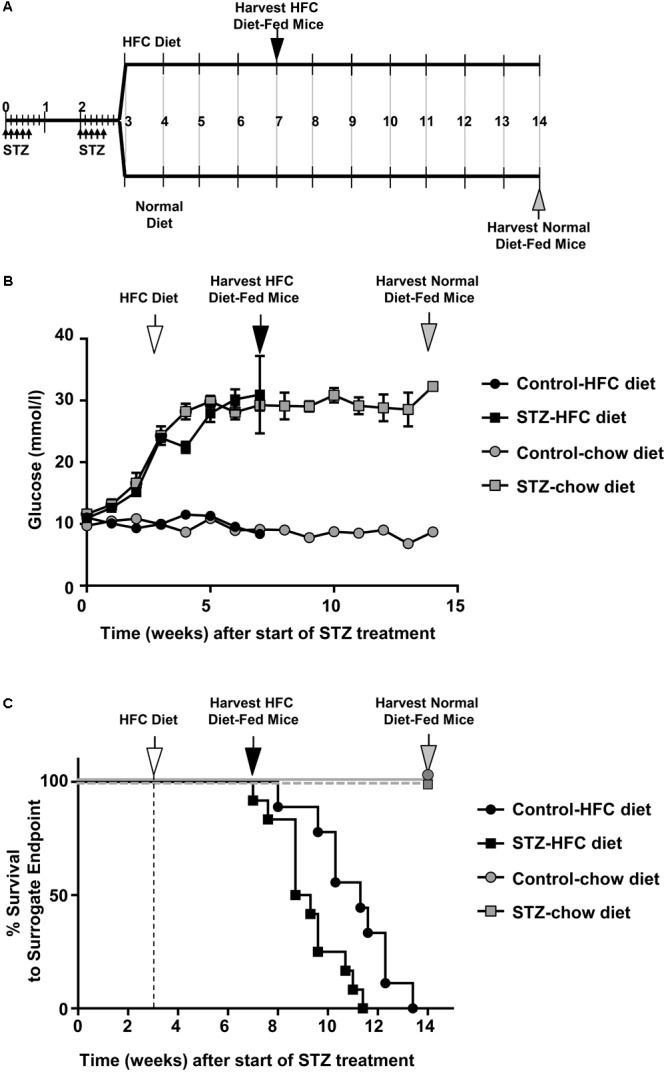
FIGURE 1.

STZ-induced diabetes is associated with reduced survival HFC diet fed SR-B1-KO/hypoE mice. (A) Schematic representation of experimental time course. Male mice were treated with two rounds of low dose (40 mg/kg body weight) STZ injections (daily for 5 days each round) during weeks 1 and 3 (small arrows). Control mice received citrate buffer (not shown). At week 3, mice were fed either a HFC diet containing 15% fat and 1.25% cholesterol, or were maintained on a normal chow diet. Mice were either euthanized for analysis at week 7 (after 4 weeks of feeding the HFC diet; black arrow), week 14 (for normal chow diet; gray arrow) or were monitored for surrogate endpoint at which time they were humanly euthanized. (B) Non-fasting blood glucose levels over the course of the study for(control- (circles) or STZ-treated mice (squares) fed either the normal chow (gray symbols) or switched to the HFC diet (white arrow; black symbols). Symbols represent means ± SEM of n = 7 (control-treated, fed normal chow), n = 6 (STZ-treated, fed normal chow), n = 14 (control-treated, fed HFC diet), and n = 15 (STZ-treated, fed HFC diet). Data were subjected to two-way ANOVA; p < 0.0001 for control- vs STZ-treated mice fed each diet, and for STZ-treated mice fed normal chow vs HFC diet. (C) Survival to surrogate endpoint for control- (circles) or STZ-treated mice (squares) fed either the normal chow diet (gray symbols) or the HFC diet (black symbols). The vertical dashed line and white arrow indicates the start of HFC diet feeding at 3 weeks (after start of STZ- or control citrate buffer treatment). P < 0.0001 for comparison between mice fed the normal chow and HFC diets and p = 0.009 for control- vs STZ-treated mice fed the HFC diet (by Mantel–Cox log-rank test).)
