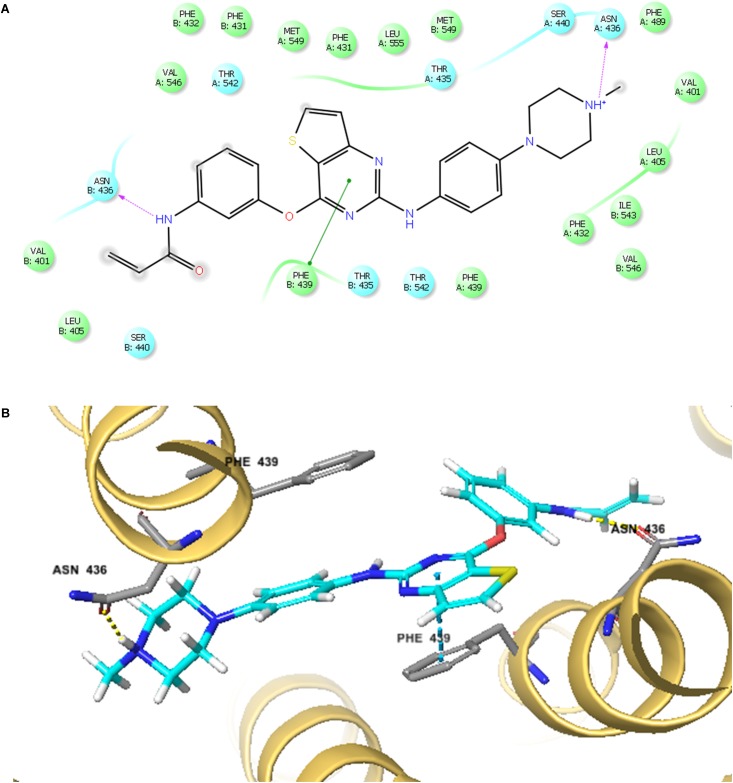
FIGURE 7.
The docking simulation of olmutinib with human ABCG2. (A) The two-dimensional ligand–receptor interaction diagram of olmutinib and human ABCG2. The amino acids within 4 Å are shown as colored bubbles, cyan indicates polar residues, and green indicates hydrophobic residues. Hydrogen bonds are shown by the purple dotted arrow. (B) Docked position of olmutinib within the binding site of human ABCG2. Olmutinib is shown as ball and stick mode with the atoms colored: carbon – cyan, hydrogen – white, nitrogen – blue, oxygen – red, and sulfur – yellow. Important residues are shown as sticks with the same color mode as above except that carbons are colored in gray.

