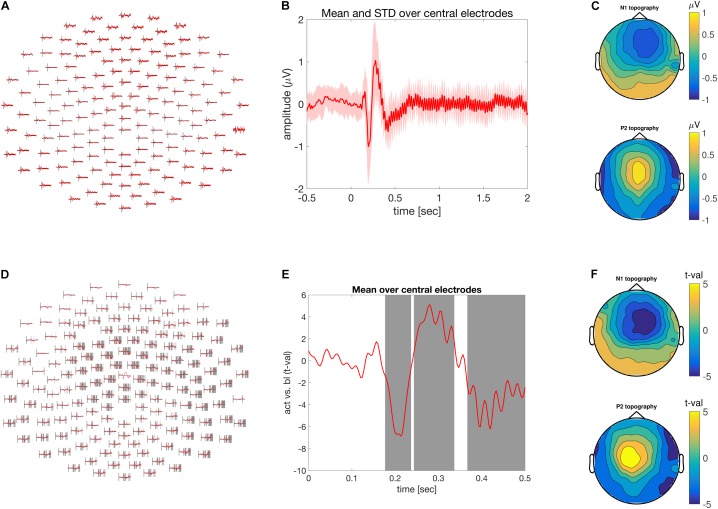
FIGURE 1.
Time-domain analysis. (A) Grand average of the ASSR across multiple electrodes. (B) ASSR averaged across central electrodes. Time is depicted on the abscissa and amplitude on the ordinate. (C) Scalp topography of the N1 top (170–230 ms) and P2 bottom (250–300) components of the grand averaged ASSR. (D) Difference between pre and post-stimulus activity across multiple electrodes expressed as units of t-values. Shaded areas at electrode clusters reflect time clusters motivating the rejection of the null hypothesis. (E) Time course of the difference between pre and post-stimulus activity expressed in units of t-values. Gray areas highlight the time clusters of significant condition differences. Time is depicted on the x-axis and difference strength on the y-axis. (F) Similar to (C), but in units of t-values.

