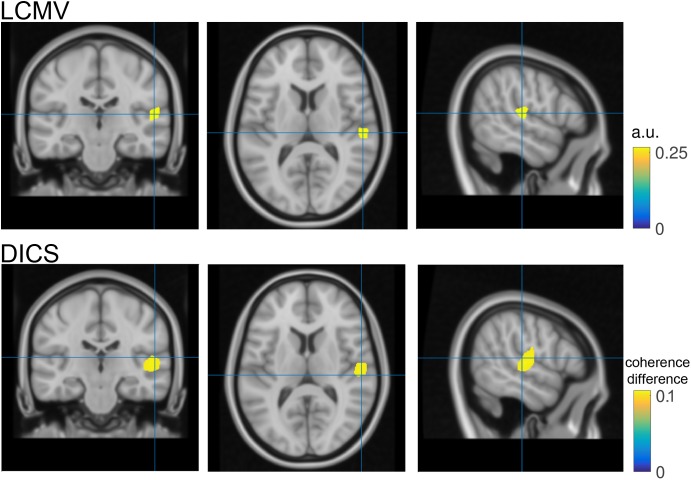
FIGURE 4.
Source reconstruction. Top- Coronal, transversal and axial slices of reconstructed N1 activity in neurological convention. The blue cross hairs correspond to the maximal activation within the right Heschl’s gyrus. Bottom- same as top but utilizing dynamic imaging of coherent sources (DICS) as source reconstruction method. Color code represents the increase in coherence with a surrogate 40 Hz signal during the post-stimulation period as compared to the pre-stimulus baseline.

