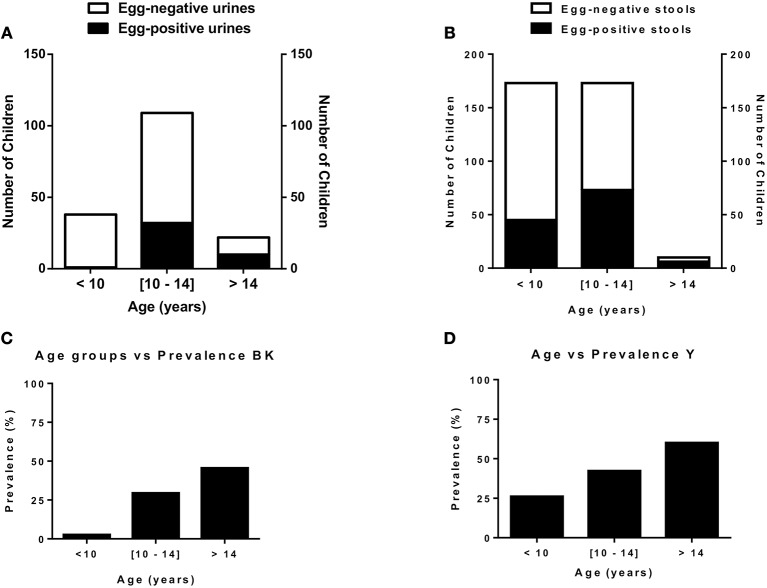
Figure 2.
Age distribution & schistosomiasis prevalence in the two endemic communities studied. (A). Distribution of children by infection status and age in Barombi-Kotto. (B). Distribution of children by infection status and age in Yoro. (C). Prevalence of infected children in Barombi-Kotto. (D). Prevalence of infected children in Yoro.

