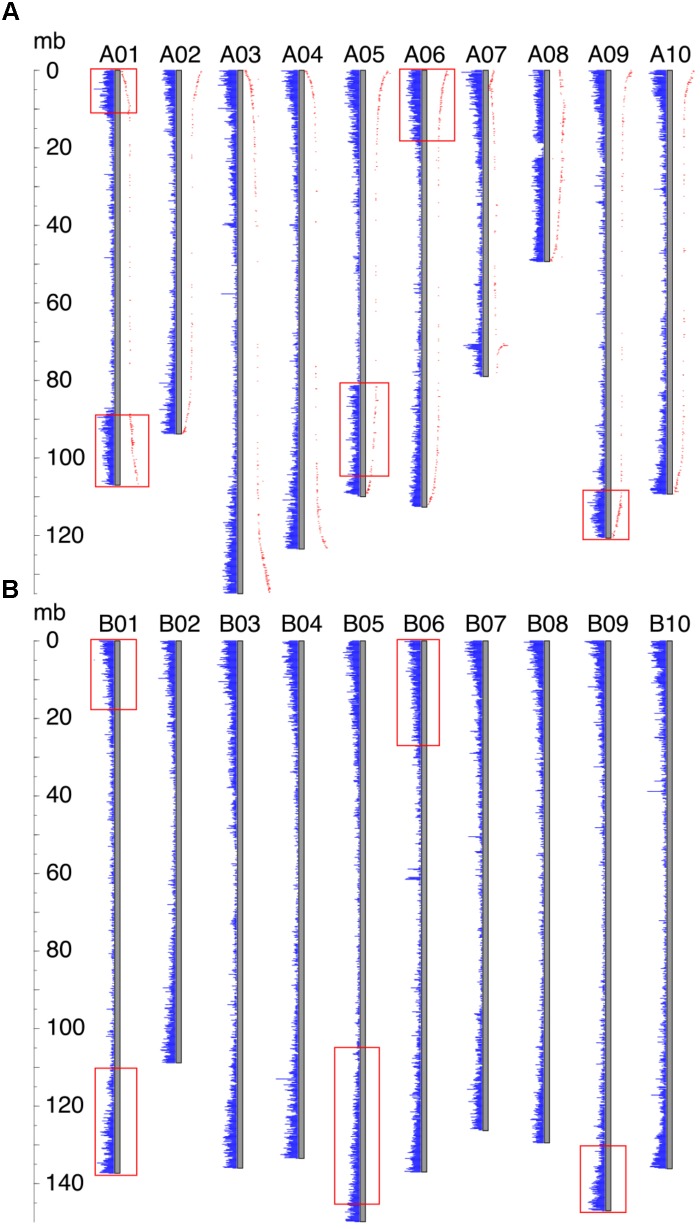
FIGURE 2.
Gene density distribution and genetic distances along the chromosome. Each gray bar represents a chromosome, and gene densities are represented by blue bars. The ruler on the left side indicates the chromosomal position. (A) Gene density distribution and genetic distances of Ad. Genetic distance is shown in red dots, and the distance from the gray bar to the red dot indicates the value of the genetic distance. Inverted regions are highlighted by red rectangles. (B) Gene density distribution of Ai. Regions in Ai which correspond to the inverted regions in Ad are highlighted by red rectangles.

