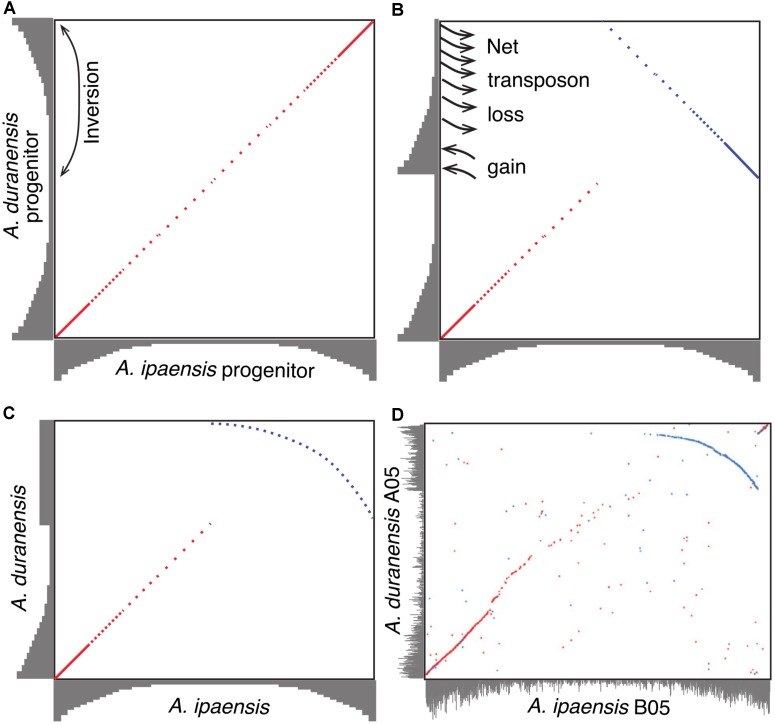
FIGURE 4.
Model of genome size reduction of inverted regions in Ad. Gene densities are shown in gray. Forward matches are shown in red, while reverse matches are shown in blue. (A) Ai and Ad share the same distribution of gene densities right after the divergence of the two species. Inversion brings the repeat-rich gene-poor proximal region to distal region, and gene-rich repeat-poor distal region to proximal region. (B) The repeat-rich region starts to loss DNA content via the deletion of repeats driven by recombination after becoming distal region, whereas the repeat-poor region begins to gain DNA content via the accumulation of repeats. (C) Higher rate of repeat deletion causes the size reduction of inverted region, and shapes the plot of the inverted region into this characteristic arc. (D) Dot-plot comparison between chromosome B05 and A05 showing that characteristic arc.

