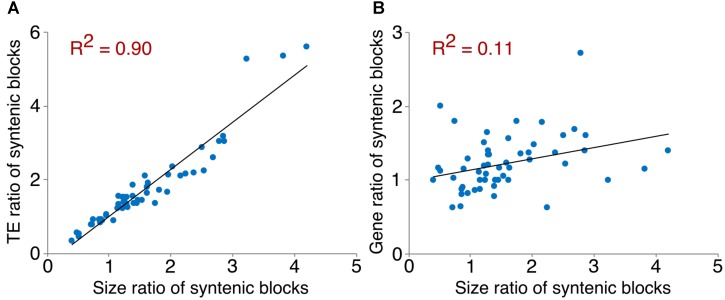
FIGURE 6.
Correlation between TE/gene ratios and size ratios of syntenic blocks. An example of scatter plots showing the correlation between TE/gene ratios and size ratios of syntenic blocks on chromosome 1. (A) Correlation between TE ratios and size ratios of syntenic blocks on chromosome 1. (B) Correlation between gene ratios and size ratios of syntenic blocks on chromosome 1.

