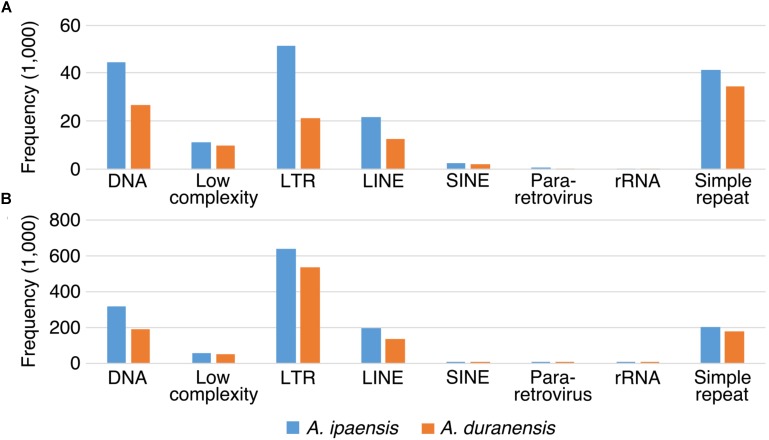
FIGURE 7.
TE components of inverted and non-inverted regions. X-axis is the name of TE components, and y-axis is the frequency of TE components. TE components in Ai genome are in blue bars, whereas TE components in Ad genome are in orange bars. (A) TE components of inverted regions. (B) TE components of non-inverted regions.

