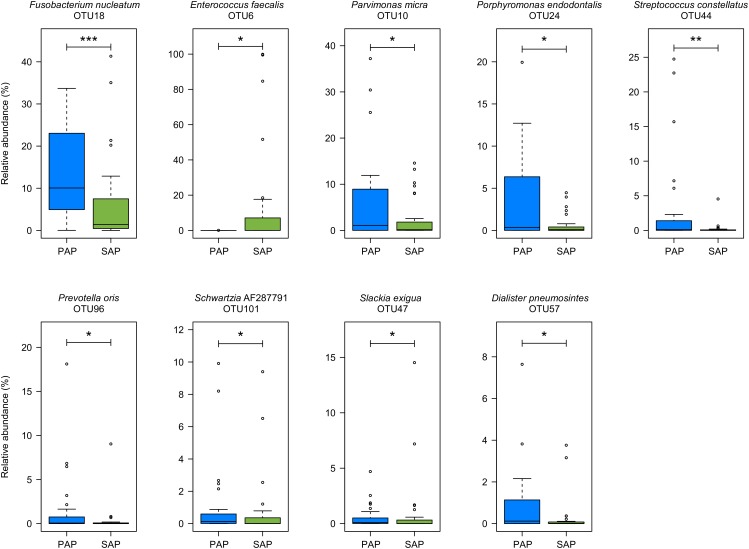
FIGURE 3.
OTUs differentially represented between PAP and SAP root samples. OTUs with significant changes (Wilcoxon rank-sum test, P < 0.05) and a minimum average relative abundance ≥0.5%) are presented. Boxplots show the first and third quartile (top and bottom edges of the rectangle) divided by median. Whiskers correspond to the highest and lowest values within 1.5× the interquartile range. Outliers are shown as circles. ∗0.01 < P < 0.05; ∗∗0.001 < P < 0.01; ∗∗∗P < 0.001. PAP, primary apical periodontitis; SAP, secondary apical periodontitis.

