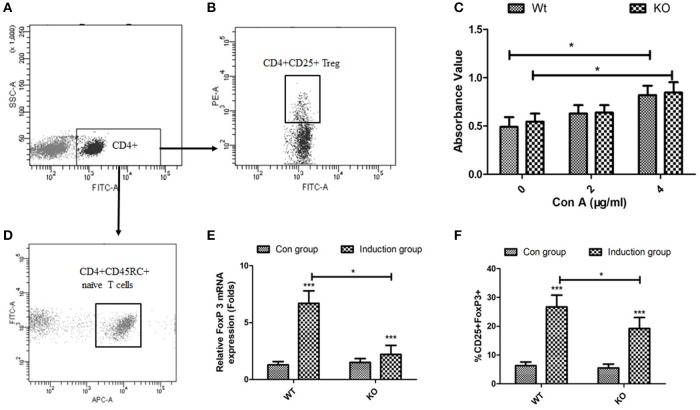
Figure 4.
Effects of EOGT knockout on Treg cell proliferation and differentiation. Flow cytometry for sorting naive CD4+ T cells (CD4+CD45RC+) (A,D) and CD4+CD25+ Tregs (A,B) from rat spleens; (C) CD4+CD25+ Tregs from Eogt+/+ and Eogt−/− rats treated with IL-2 without or with different Con A concentrations for 48 h; (E) Foxp3 mRNA levels and (F) percentages of regulatory T cells (CD25+Foxp3+) differentiated from naive CD4+ T cells (CD4+CD45RC+). Data are mean ± SD from three independent experiments. *P < 0.05; ***p < 0.001, vs. WT control group.

