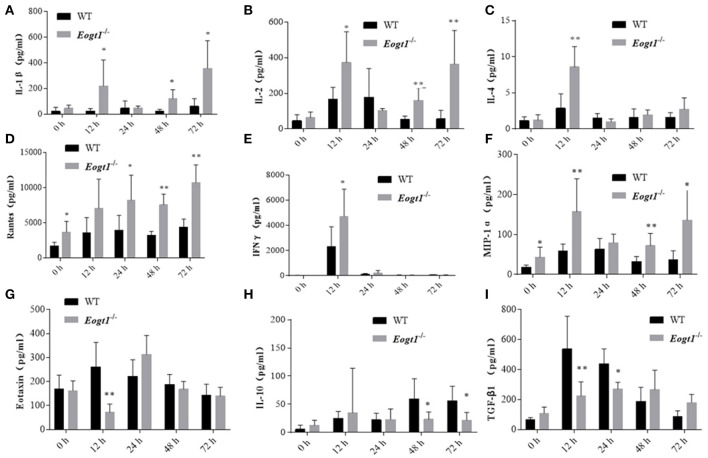
Figure 5.
Luminex multiplex analysis of cytokine levels in rat serum. Column charts respectively show serum levels of 9 cytokines in Eogt+/+ and Eogt−/− rats after Con-A injection at 0, 12, 24, 48, and 72 h. Data are mean ± SD from three independent experiments. *P < 0.05; **P < 0.01, vs. WT control group. (A) IL-1β, (B) IL-2, (C) IL-4, (D) Rentes, (E) IFN-r, (F) MIP-1α, (G) Extaxin, (H) IL-10, (I) TGF-β1.

