Figure 1.
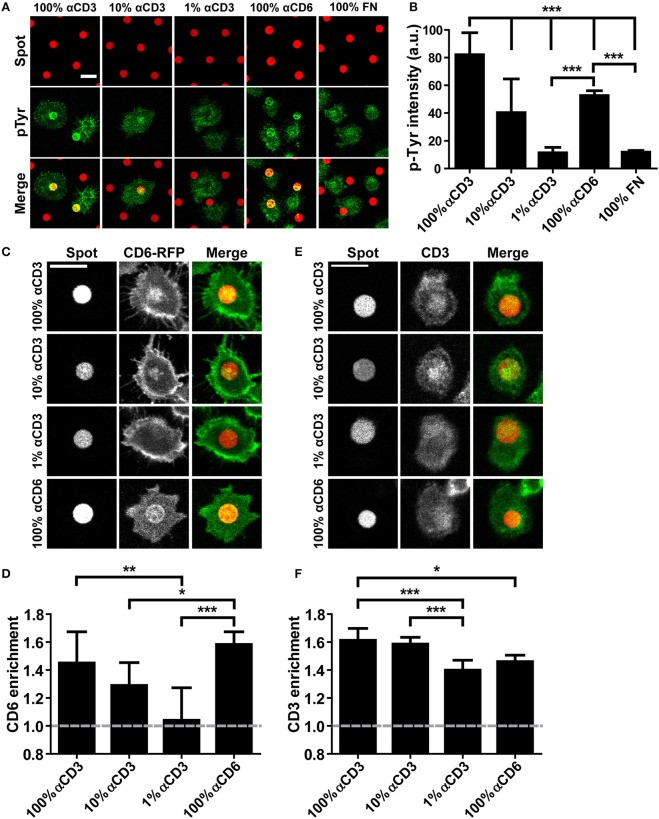
CD6 and TCR/CD3 in Jurkat T cells co-localize upon ligation through micropatterned antibody spots. (A,B) Wildtype Jurkat T cells were seeded on micropatterned substrates containing 100, 10, or 1% αCD3 spots, 100% αCD6 spots or 100% fibronectin (FN) spots, surrounded by fibronectin, fixed after 15 min and stained for phospho-tyrosine. All spots were labeled with Alexa647, phospho-tyrosine was labeled with Alexa488. Representative confocal images are shown in (A), quantification of phospho-tyrosine intensity in the spot area of n = 10 cells per condition is shown in (B). Bars represent mean with SD. Statistical significance was tested with one-way ANOVA with post-hoc Tukey's Multiple Comparison test. (C,D) CD6-RFP Jurkat T cells were seeded on micropatterned substrates containing 100, 10, or 1% αCD3 spots, or 100% αCD6 spots, surrounded by fibronectin, and fixed after 15 min. All spots were labeled with Alexa647. Representative confocal images are shown in (C), quantification of CD6 enrichment of n = 10 cells per condition is shown in (D). CD6 enrichment is defined as the ratio between CD6-RFP intensity of parts of the cell on the spot vs. part of the cell covering the surrounding fibronectin. Bars represent mean with SD. Statistical significance was tested with Kruskal–Wallis test with post-hoc Dunn's Multiple Comparison test. (E,F) Wildtype Jurkat cells were seeded on micropatterned substrates containing 100, 10, or 1% αCD3 spots, or 100% αCD6 spots, surrounded by fibronectin, fixed after 15 min and stained for CD3. All spots were labeled with Alexa647, CD3 was labeled with TexasRed. Representative confocal images are shown in (E), quantification of CD3 enrichment of n = 10 cells per condition is shown in (F). Bars represent mean with SD. CD3 enrichment is defined as the ratio between CD3 intensity of parts of the cell on the spot vs. part of the cell covering the surrounding fibronectin. Statistical significance was tested with Kruskal–Wallis test with post-hoc Dunn's Multiple Comparison test. Scale bars represent 10 μm; *p < 0.05; **p < 0.01; ***p < 0.001.

