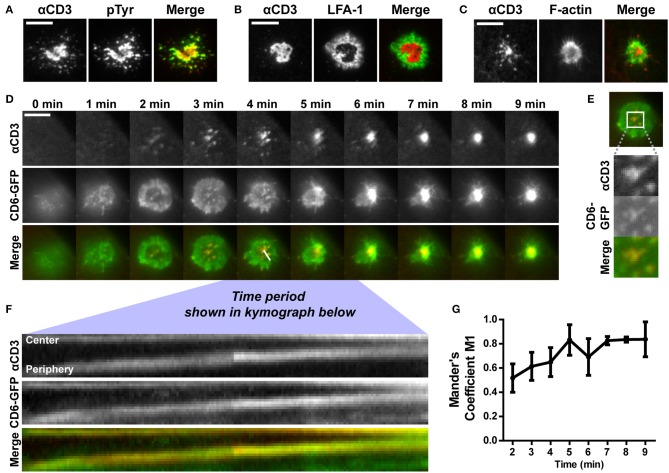
Figure 3.
CD6 is co-transported with TCR/CD3 in microclusters toward the center of the immunological synapse formed on αCD3-containing SLBs. (A,B) Wildtype Jurkat T cells were seeded for 30 min on SLBs containing ATTO647-conjugated αCD3, and subsequently fixed and stained for immunological synapse markers. Representative TIRF microscopy images for phospho-tyrosine staining and LFA-1 staining (both labeled with Alexa488) are shown in (A,B) respectively. (C) LifeAct-GFP Jurkat T cells were seeded for 30 min on SLBs containing ATTO647-conjugated αCD3 and imaged using live cell imaging TIRF microscopy. Representative images are shown in (C). (D–G) CD6-GFP Jurkat T cells were imaged while settling on a SLB containing ATTO647-conjugated αCD3, using TIRF microscopy live cell imaging. Snap shots of every minute of the time lapse are shown in (D). Snap shots at time point 3 min, including a zoom-in of CD6-GFP and αCD3 microclusters are shown in (E). Kymograph of the line (indicated in the Merge image at time point 4 min in D) during 3:45 to 6:12 min of the imaging period is shown in (F). Co-localization over time starting at time point 2 min, represented as Mander's coefficient M1 (fraction of CD6-GFP overlapping with αCD3) in the central zoomed-in region indicated in (E) is shown in (G). Scale bars represent 10 μm.

