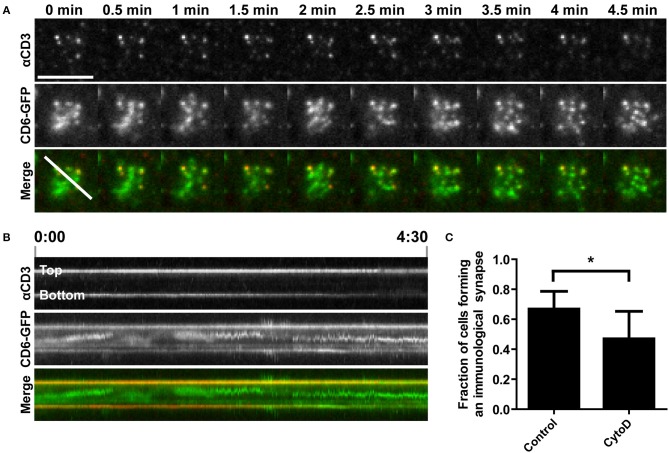
Figure 4.
Disruption of actin polymerization inhibits TCR/CD3 and CD6 co-transport toward the cSMAC of the immunological synapse on αCD3-containing SLBs. (A,B) CD6-GFP Jurkat T cells, either untreated or pretreated with 0.5 μM Cytochalasin D for 15 min, were seeded on a SLB containing ATTO647-conjugated αCD3. Twenty minutes after seeding CD6-GFP and αCD3 dynamics were imaged using TIRF microscopy live cell imaging. Snap shots of every 30 s of the time lapse are shown in (A). Kymograph of the line (indicated in the Merge image at time point 0 min in A) during the whole imaging period (4.5 min) is shown in (B). (C) Wildtype Jurkat T cells, either untreated or pretreated with 0.5 μM Cytochalasin D for 15 min, were seeded for 30 min on SLBs containing ATTO647-conjugated αCD3, and subsequently fixed. Widefield microscopy was performed and cells (>44 cells per condition; three independent experiments) were scored for synapse formation based on identification of cells by brightfield displaying αCD3 positive cluster formation in a lipid bilayer (DiI) positive area. Average percentages of cells forming an immunological synapse are represented in (C). Bars represent mean with SD. Statistical significance was tested with paired t-test. Scale bar represents 10 μm; *p < 0.05.

