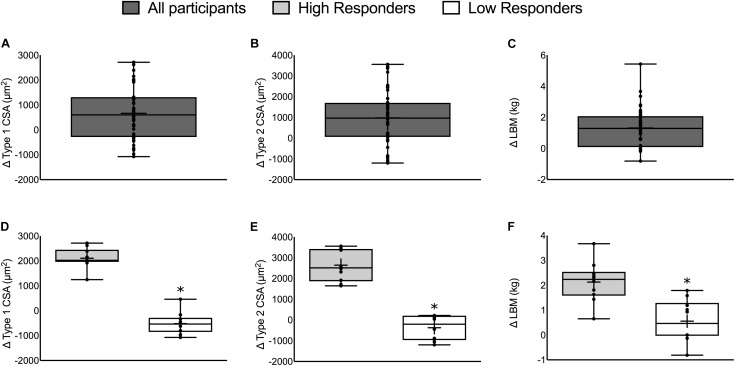
FIGURE 1.
The change in muscle mass in all participants (top) and HIR and LOR (bottom). Top panels: The change in (A) type 1 CSA, (B) type 2 CSA, and (C) LBM from all 49 participants. Bottom panels: The change in (D) type 1 CSA, (E) type 2 CSA, and (F) LBM categorized into HIR and LOR. Values are presented as median (lines) with interquartile range (boxes), range (minimum and maximum), and mean (cross). ∗Significant difference between high- and low-responders (P < 0.01). Panels A–C adapted from Morton et al. (2016).

