FIGURE 10.

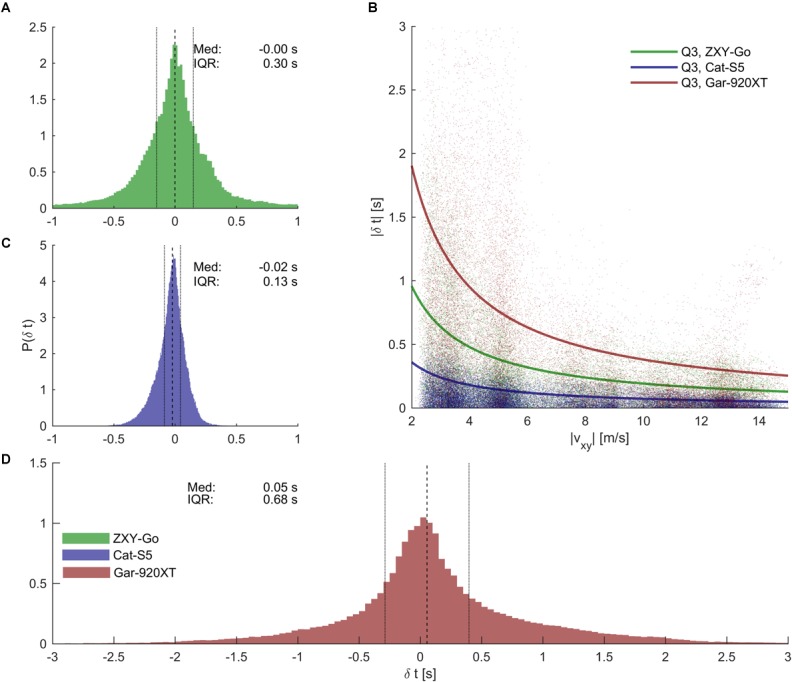
Time analysis errors. (A, C, D) Error distributions for time analysis errors for the three evaluated receivers [see legend in (D) for color specifications]. Dashed lines indicate median time error, and dotted lines IQR. Cat-S5 provided the most precise split times, followed by ZXY-Go and Gar-920XT. (B) Scatter plot showing that split time precision appeared to be inversely related to skiing speed (|vxy|) at the split time position. The solid lines are the hyperbolic functions | δt| = c/|vxy| encompassing 75% of the samples (i.e., the third quartile).
