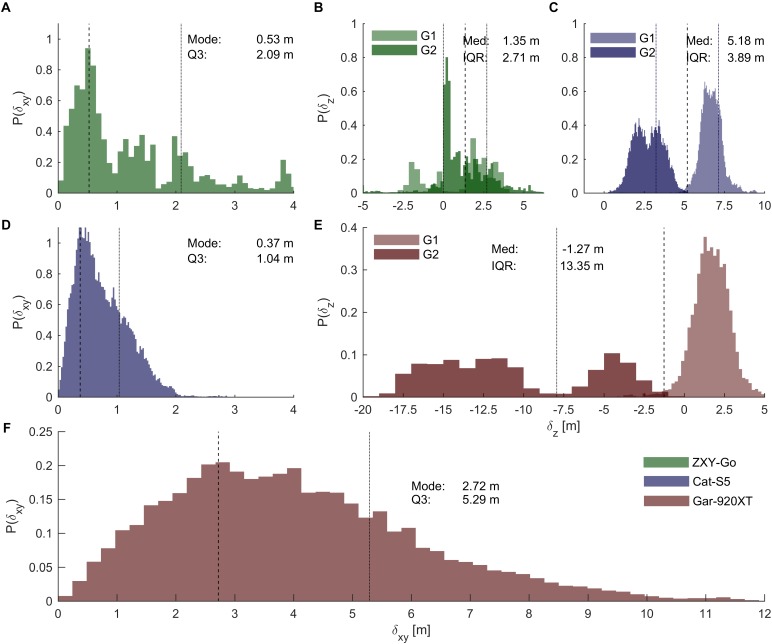
FIGURE 5.
Position errors. (A,D,F) Distributions of horizontal plane errors for ZXY-Go, Cat-S5, and Gar-920XT, respectively. Dashed lines, distribution mode; dotted lines, third quartile. Horizontal axes are equally scaled. (B,C,E) Distributions of vertical error for ZXY-Go, Cat-S5, and Gar-920XT, respectively. Dashed lines, median error; dotted lines, IQR. Horizontal axes are equally scaled. The vertical error distributions of the two standalone receivers were clearly multi-modal, which suggests that the offset changed with time (as indicated by the different color saturation for the two groups of skiers, G1 and G2). Therefore, the analysis was also done on a lap-by-lap basis to evaluate accuracy and precision over shorter (∼9 min) time intervals (Table 2).

