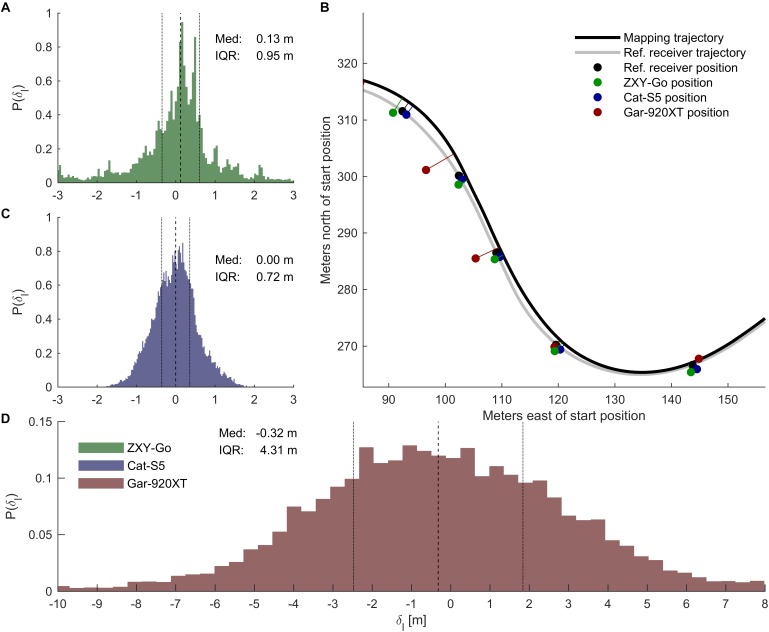
FIGURE 6.
Mapping on mapping trajectory. (B) Section of the track showing how a subset of receiver coordinates were mapped onto the mapping trajectory (black line). The gray line shows the trajectory of the reference receiver for the given trial. The dots are the receivers’ coordinates sampled at the same time, with 3-s intervals (see legend for color specification). (A,C,D) Distributions of the mapped position errors, quantified as the distance to the reference receiver position along the mapping trajectory [see legend in (D) for color specification].

