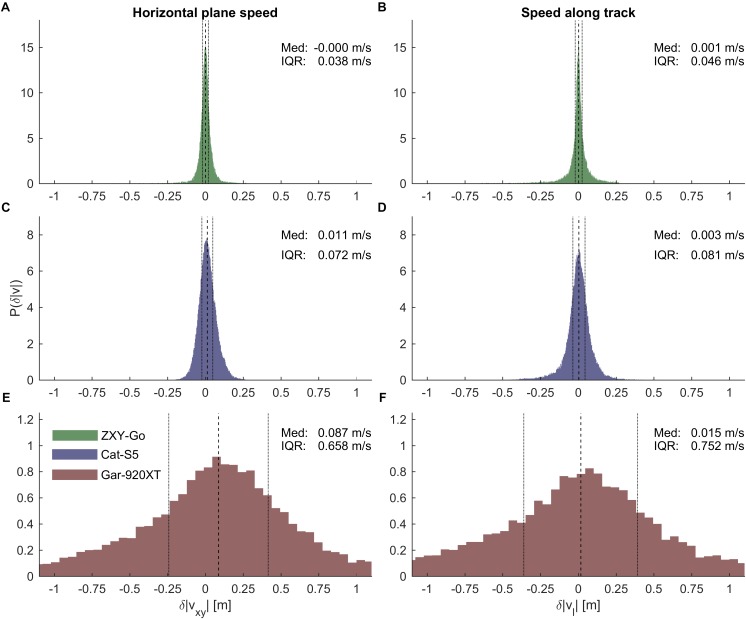
FIGURE 7.
(A,C,E) Error distribution of horizontal plane speeds for ZXY-Go, Cat-S5, and Gar-920XT, respectively. (B,D,F) Error distributions of speed along the mapping trajectory for ZXY-Go, Cat-S5, and Gar-920XT, respectively. Dashed lines, median error; dotted lines, IQR. Horizontal axes are equally scaled. The ZXY-Go receiver showed the highest precision. Cat-S5 was comparable to the ZXY-Go receiver, while Gar-920XT showed substantially lower precision.

