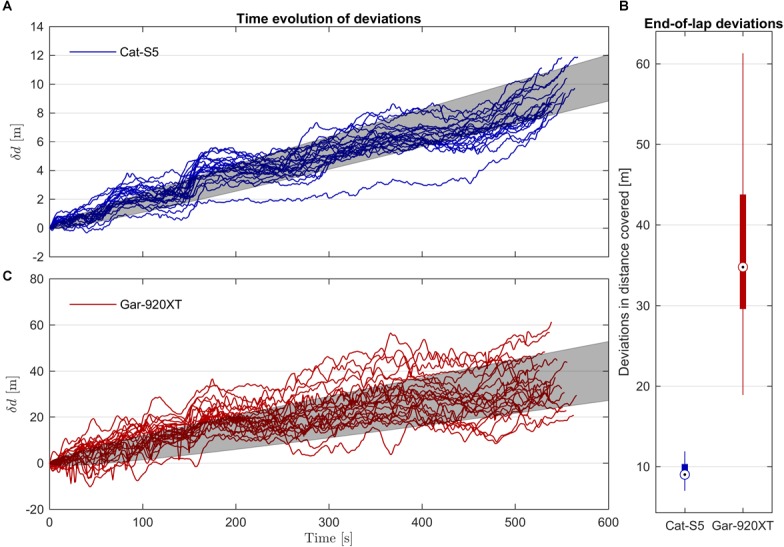
FIGURE 8.

(A, C) Time evolution of the error in distance covered for Cat-S5 and Gar-920XT when compared to the distance covered by the reference receiver. Note the different scaling of the vertical axes. The errors show a linear drift term in agreement with the systematic difference in speed measurements between the evaluated receivers and the reference receiver. In addition, stochastic errors cause a deviation from the linear drift line which was approximately proportional to the square root of time. The gray shaded regions indicate the RMSD from the linear drift. (B) Box plot of the errors in distance covered evaluated at the end of each lap. Both Cat-S5 and Gar-920XT overestimated distance covered compared to the reference receiver, but Cat-S5 was substantially more precise.
