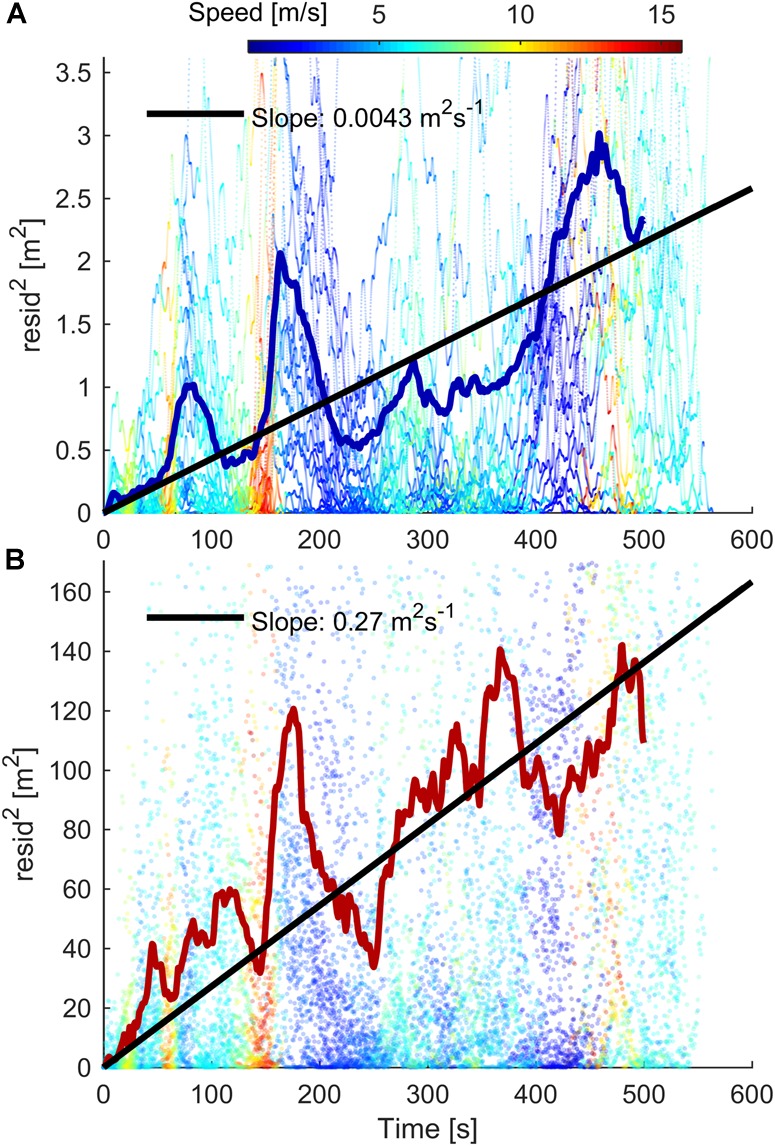
FIGURE 9.

Scatter plots of the squared deviations from the linear drift line in Figure 8 for Cat-S5 (A) and Gar-920XT (B). The residuals are color-coded based on skiing speed. Solid colored lines show the mean-squared deviation at the given time. Black lines are the least squares fit (with zero y-intercept) to all the measurements. If the errors in speed were independent, identically distributed, and zero-mean, the expectation value of the squared error in distance covered would increase linearly with time (by Donsker’s theorem). In this experiment, these assumptions are violated due to changing receiver conditions and low-pass filtering of the trajectories. Nonetheless, the after subtraction of the linear drift, the error increases approximately linearly with time.
