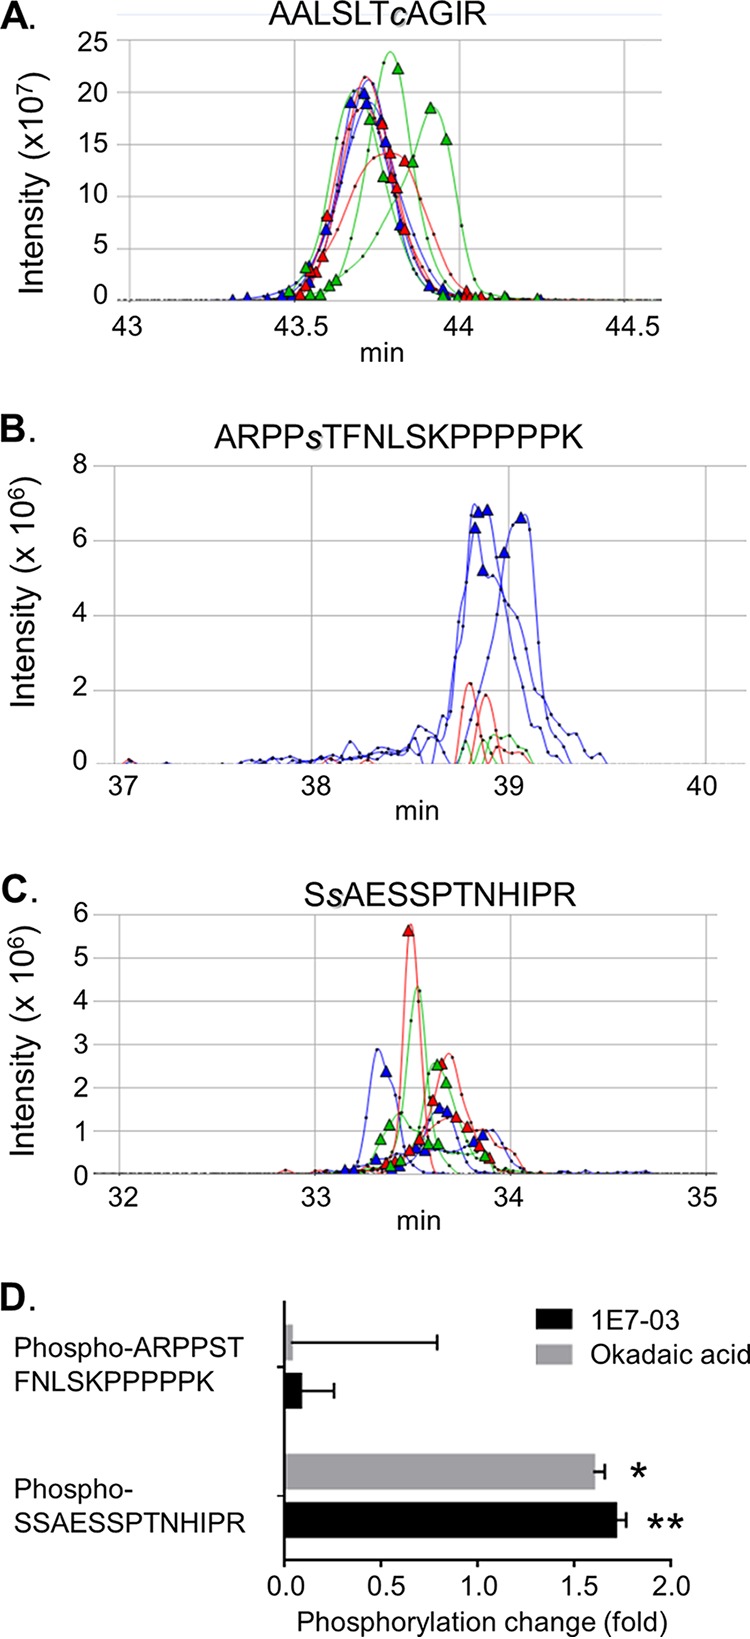
FIG 4.

Treatment with phosphatase inhibitors increases phosphorylation of MARV VP30. (A to C) Quantitative analysis of MARV peptide expression using SIEVE, version 2.1. Ion elution profiles are shown in blue for control samples, in red for the cells treated with 1E7-03, and in green for the cells treated with okadaic acid. The AALSLTcAGIR peptide was used for normalization. Triangles indicate the time points at which MS/MS was conducted. Representative data from three independent experiments are shown. (D) Ratios of the ion peaks for ARPPsTFNLSKPPPPPK and SsAESSPTNHIPR peptides in 1E7-03- or okadaic acid-treated cells to that in nontreated cells. Values are means ± standard deviations based on three samples. Peaks were integrated, and a P value was calculated using SIEVE, version 2.1. *, P = 8.7 × 10⁻¹⁵; **, P = 4.3 × 10⁻¹¹.
