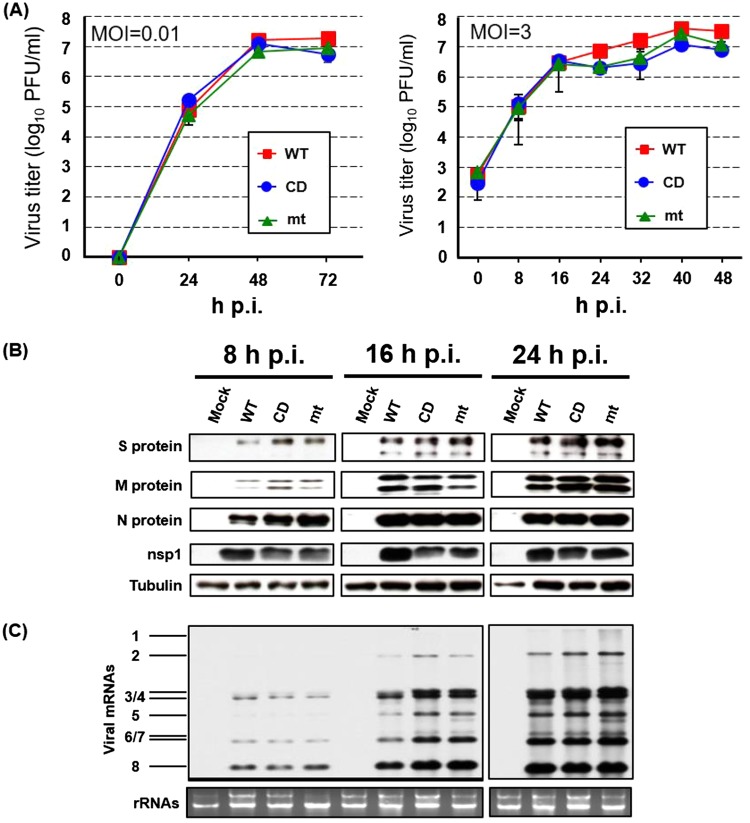
FIG 2.
Growth kinetics of MERS-CoV-WT, -CD, and -mt and accumulation of viral proteins and RNA in infected Vero cells. (A) Vero cells were infected with MERS-CoV-WT (WT), MERS-CoV-CD (CD), or MERS-CoV-mt (mt) at an MOI of 0.01 (left panel) or 3 (right panel). Culture supernatants were collected at the indicated times, and virus titers were determined by plaque assay in Vero cells. The results represent the averages of three independent experiments. Each bar represents the mean (± the standard deviation) for three samples. (B) Vero cells were infected with each of the three viruses at an MOI of 3. At indicated times postinfection, total proteins were extracted and Western blot analysis was performed to detect the S, M, N, nsp1, and tubulin by using anti-MERS-CoV S, M, N, nsp1, and tubulin antibody, respectively. (C) Vero cells were infected with each of the three viruses at an MOI of 3. At the indicated times, total RNAs were extracted. The viral mRNAs were detected by Northern blotting using a probe that binds to the 3′ end of the MERS-CoV genome. The 28S and 18S rRNAs were detected by ethidium bromide staining.

