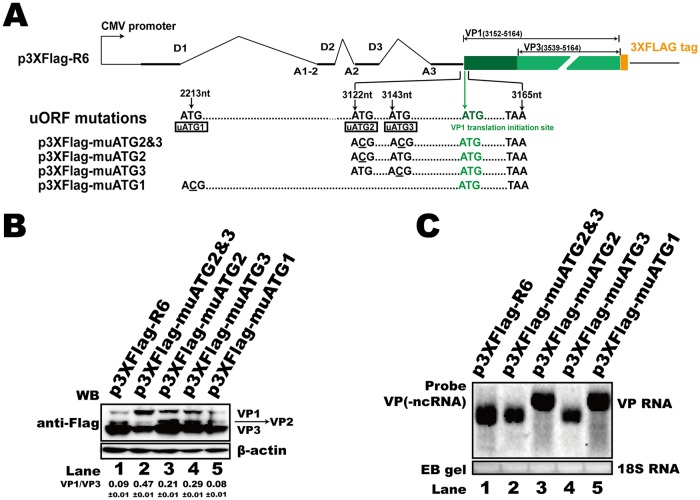
FIG 7.
uATGs influenced HBoV1 capsid protein expression. (A) Diagram of HBoV1 uATG-mutated constructs. The positions of uATG1, uATG2, and uATG3 are denoted by their nucleotide sequence numbers. (B) Western blot. The transfected HEK293T cell lysates were analyzed using anti-Flag antibody, and β-actin served as the loading control. (C) Northern blot. Total RNAs were harvested from transfected cells, and Northern blotting was carried out as described in the legend to Fig. 2D. Ethidium bromide (EB)-stained 18S RNA bands are shown as the loading control. ncRNA, noncoding RNA.

