FIG 6.
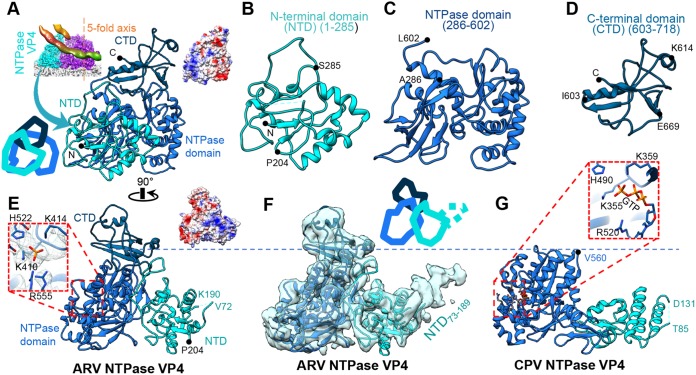
Structure of NTPase VP4. (A to E) Ribbon diagrams of the atomic model of VP4 shown in two orthogonal views with its three domains in different colors (A and E) or in larger views as separated individual domains (B to D). (F and G) Comparison of NTPases from ARV (F) and CPV (G) (13) demonstrating the existence of an extra CTD (aa 603 to 718) in ARV. The atomic model is superimposed on a low-pass-filtered density map (semitransparent surface) showing the flexible (and thus unmodeled) NTD73–189 subdomain (F) in contrast to the shorter flexible segment NTD86–130 in CPV (G). The boxed region in panel E contains a phosphate group, whose location is equivalent to the third phosphate in GTP identified in the CPV NTPase in the boxed region in panel G. Cartoon diagrams were added to panels A and F to show the position of each domain. Surface charge diagrams were added to panels A and E in the same views.

