
Fig. 5.
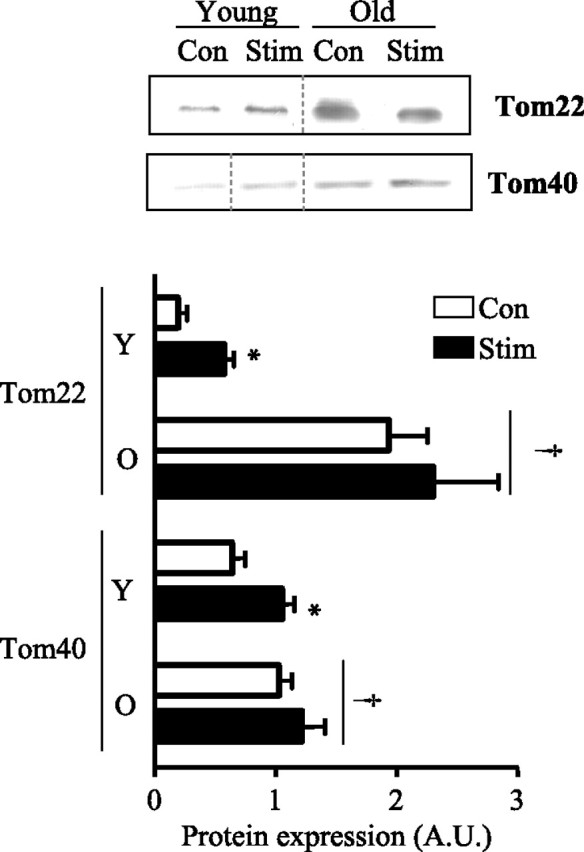
Altered levels of Tom22 and Tom40 following CCA in young (Y) and aged (O) animals. Top: representative Western blots of Tom22 and Tom40 in stimulated and nonstimulated mitochondria from young and aged animals. Dashed lines indicate that lanes from the gel have been excised and the lanes from a single gel reordered to show a representative image. Bottom: graphical representation of multiple experiments (n = 5–10). Values were corrected for porin and are expressed as arbitrary units. †P < 0.05, main effect of age; *P < 0.05, Stim vs. Con.