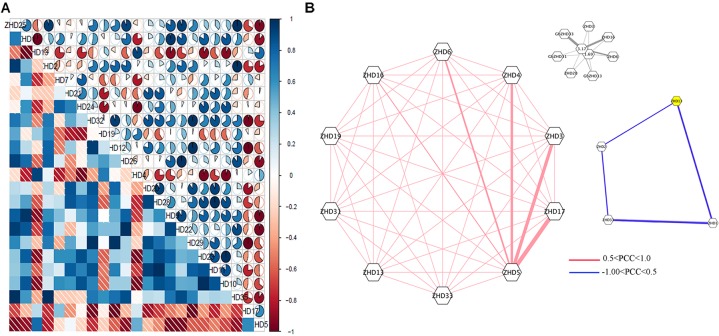
FIGURE 4.
(A) Correlation analysis during abiotic stress. Correlation analysis was carried out using the R package program. Lower squares: correlations indicated by color and shading intensity. Upper circular symbols: each correlation is shown by the shades of blue and red and the size of the fan shape. Blue and red indicate a positive correlation and a negative correlation, respectively. (B) Co-regulatory networks. The co-regulatory networks of 37 GhZHD genes under stress treatments were established based on the Pearson correlation coefficients (PCCs) of these gene pairs using RNA-Seq data. The PCC of co-regulatory gene pairs was considered significant at the 0.05 significance level (p-value). Different color line styles indicate the different significance levels of the co-regulated gene pairs.

