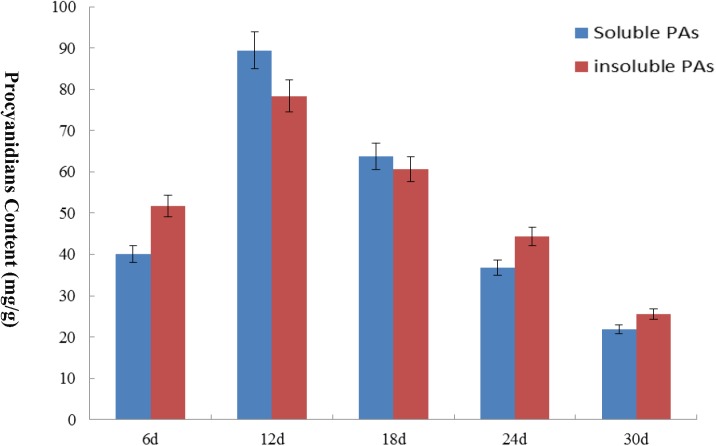
FIGURE 6.
The PA content of brown cotton at different fiber development stages. The content levels of soluble PA and insoluble PA are expressed in different colors. The x-axis indicates different days of post-anthesis of cotton fibers, and the y-axis indicates the PA content. Error bars indicate SE.

