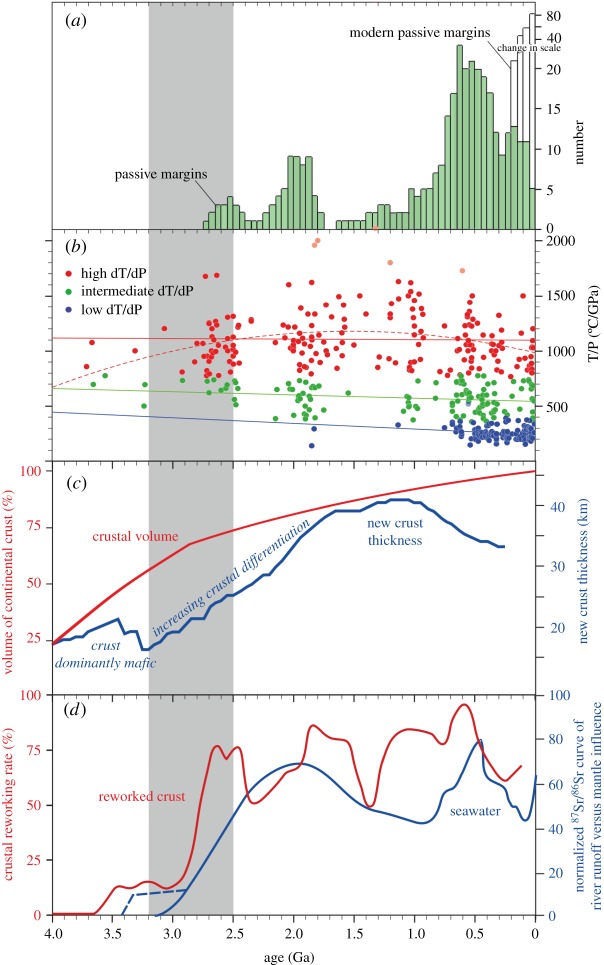
Figure 5.
(a) Histogram of the ages of ancient and modern passive margins [67]. (b) Metamorphic thermal gradient (T/P) for 456 localities grouped as high dT/dP in red, intermediate dT/dP in green and low dT/dP in blue, and plotted against age [64]. (c) Crustal growth model based on Hf isotope ratios in zircons [79] and a shift in the composition of juvenile crust from mafic to more intermediate compositions accompanied by an inferred increase in crustal thickness [80]. (d) Moving average of δ18O analyses of zircon versus U-Pb ages distilled from compilation of approximately 3300 [81] and normalized seawater 87Sr/86Sr curve [82], incorporating data of Satkoski et al. [83,84]. Grey bar highlights age range 3.2–2.5 Ga.

