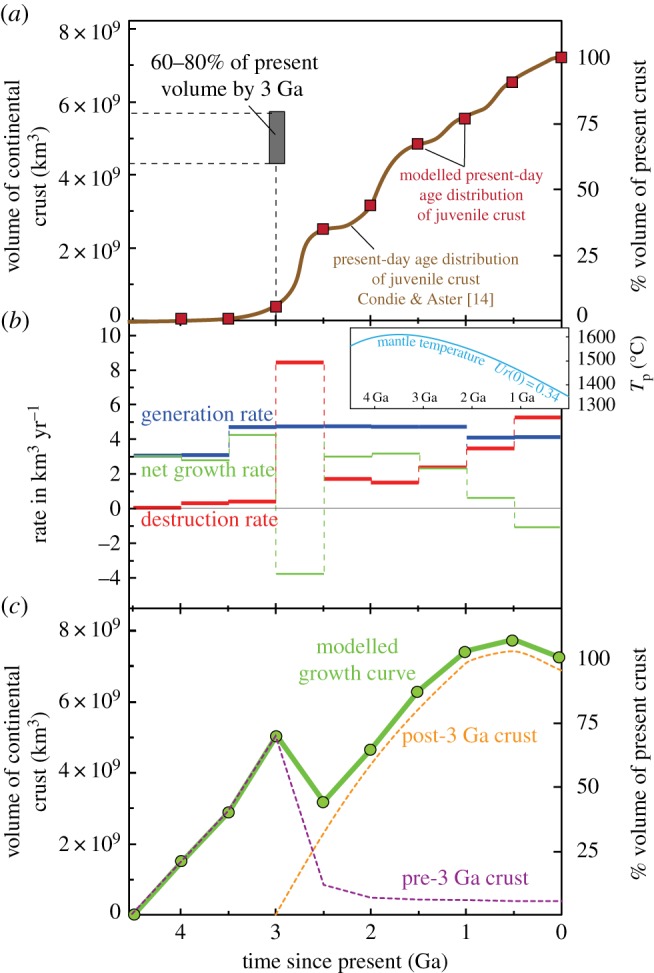
Figure 4.

Model 1 for the volume and rates of generation and destruction of the continental crust through time, estimated from the box model approach schematized in figure 3. (a) Cumulative curve for the present-day distribution of juvenile crust (brown curve, after [14]), which is the target of the model, and the modelled present age distribution (red squares). The grey box at 3 Ga represents the conditional starting parameter of the model, i.e. 60–80% of the present-day volume of continental crust established by 3 Ga [2,8,12,13]. (b) Rates of generation (blue curve), destruction (red curve) and net growth (green curve) of the continental crust, for every 500 Myr step of the model. The inset shows the smooth evolution of the mantle temperature through time, after Herzberg et al. [39] and Korenaga [40]. (c) Volumes of continental crust calculated for every 500 Myr step of the model (green curve), and estimated changes in the volumes of pre-3 Ga (purple curve) and post-3 Ga (orange curve) continental crust through time.
