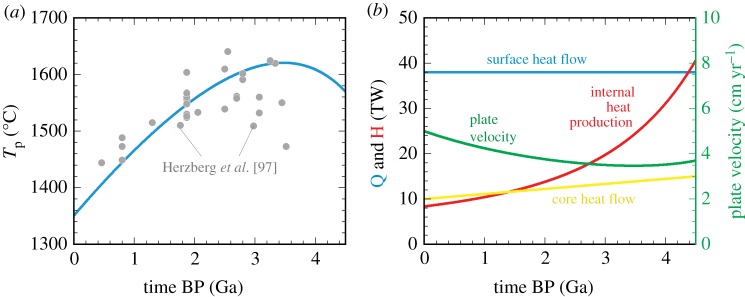
Figure 9.
(a) Petrological estimates on the past potential temperature of the ambient mantle (grey circles) [97], and the predicted thermal history (blue curve) using the constant surface heat flow with the present-day Urey ratio of 0.22 [134]. The core heat flow is assumed to vary linearly from 15 TW at 4.5 Ga to 10 TW at present [172]. (b) Surface heat flow (blue), core heat flow (yellow) and radiogenic heat production in the mantle (red) used for the thermal history shown in (a). Also shown is corresponding plate velocity (green), with the present-day average velocity of 5 cm yr−1 [173].

