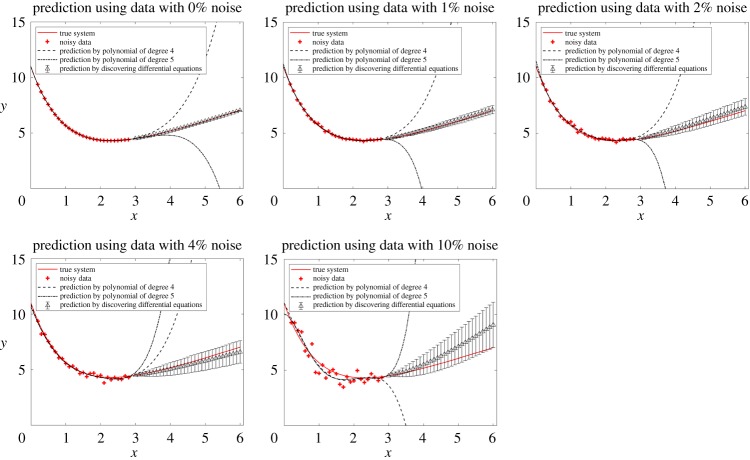
Figure 6.
Comparison of polynomial regressions with the method of discovering differential equations in the prediction of (4.20). Different levels of noise are studied. In this example, 31 equally spaced data points with step size 0.1 are collected on [0, 3]. Polynomial regressions use all of the 31 data points, but for discovering differential equations, we calculate the derivatives of the middle 27 data points using central difference formula. Then the other four data points are discarded and only 27 data points are used in our algorithm. The prediction by discovering differential equations at each x reads as ‘mean ( ± s.d.)’. Although the method of discovering differential equations uses less data points and introduces more error when calculating numerical derivatives, it has much better performance in prediction than polynomial regressions. (Online version in colour.)

