Fig. 2.
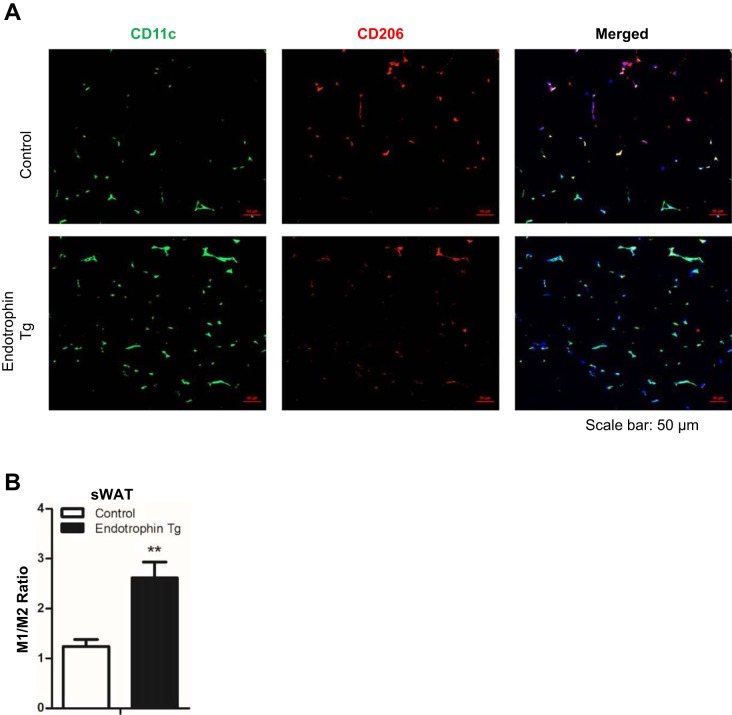
Locally derived endotrophin in sWAT induces M1 macrophage polarization under a HFD challenge. A: coimmunofluorescent staining of CD11c (M1 macrophage marker) and CD206 (M2 macrophage marker) on sWAT of endotrophin Tg mice and their littermate controls, showing increased M1 macrophages (green) and decreased M2 macrophages (red) in the endotrophin Tg group vs. controls (cell nuclei were visualized by staining with DAPI; scale bar, 50 μm). B: quantification of M1/M2 ratio for the area of positive stains in sWAT by ImageJ software (3 different fields from n = 2 per group, Student’s t-test, ** P < 0.01).

