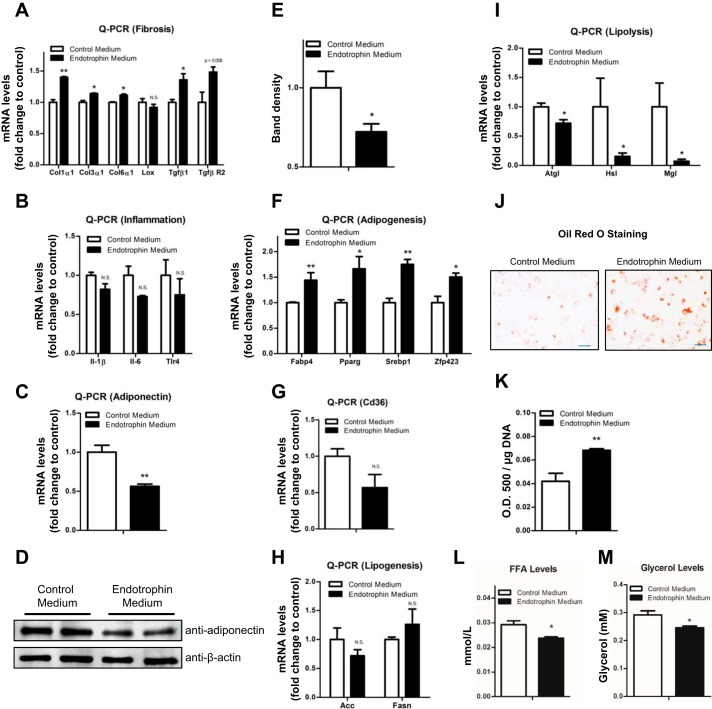
Fig. 4.
Endotrophin stimulates fibrosis and lipid accumulation in differentiating 3T3-L1 adipocytes. A: qPCR analysis of mRNA levels of fibrotic genes Col1α1, Col3α1, Col6α1, Lox, Tgfβ1, and TgfβR2 in differentiating 3T3-L1 cells treated with control or endotrophin-conditioned medium (data are means ± SE; n = 3. Student’s t-test, *P < 0.05). B: qPCR analysis of mRNA levels of inflammatory genes IL1β, IL-6, and Tlr4 in differentiating 3T3-L1 cells treated with control or endotrophin-conditioned medium (data are means ± SE; n = 3. Student’s t-test). C: qPCR analysis of mRNA levels of adiponectin in differentiating 3T3-L1 adipocytes treated with control or endotrophin-conditioned medium (data are means; ± SE n = 3. Student’s t-test, **P < 0.01). D and E: Western blot analysis (D) and quantification by density of the bands on the Western blot by ImageJ software (E) for adiponectin in differentiating 3T3-L1 adipocytes treated with control or endotrophin-conditioned medium. Results were normalized with β-actin (data are means ± SE; n = 3. Student’s t-test, *P < 0.05). F: qPCR analysis of mRNA levels of adipogenic factors Fabp4, Pparγ, Srebp1, and Zfp423 in differentiating 3T3-L1 cells treated with control or endotrophin-conditioned medium (data are means ± SE; n = 3. Student’s t-test, *P < 0.05, **P < 0.01). G: qPCR analysis of mRNA levels of Cd36 in differentiating 3T3-L1 cells treated with control or endotrophin-conditioned medium (data are means ± SE; n = 3. Student’s t-test). H: qPCR analysis of mRNA levels of lipogenic genes Acc and Fasn in differentiating 3T3-L1 cells treated with control or endotrophin-conditioned medium (data are means ± SE; n = 3. Student’s t-test). I: qPCR analysis of mRNA levels of lipolytic genes Atgl, Hsl, and Mgl in differentiating 3T3-L1 cells treated with control or endotrophin-conditioned medium (data are means ± SE; n = 3. Student’s t-test, *P < 0.05). J and K: visualization (J) and quantification by ImageJ software (K) of lipid droplets by Oil red O staining. (data are means ± SE; n = 3. Student’s t-test, **P < 0.01, scale bar, 100 μm). L: analysis of FFA levels in cultured medium for 3T3-L1 cells treated with control or endotrophin-conditioned medium (data are means ± SE; n = 3. Student’s t-test, *P < 0.05). M: analysis of glycerol levels in cultured medium for 3T3-L1 cells treated with control or endotrophin-conditioned medium (data are means ± SE; n = 3. Student’s t-test, *P < 0.05).

