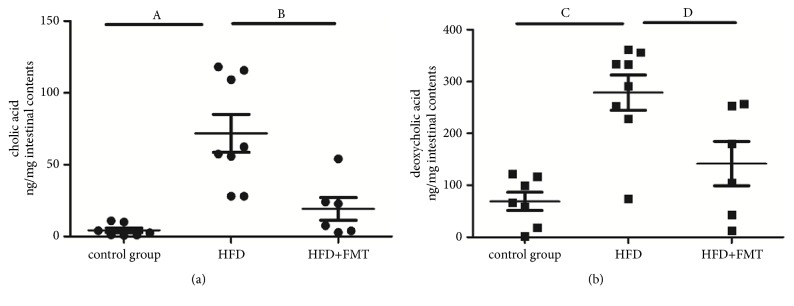
Figure 5.
The levels of DCA and CA in intestinal contents of the three groups. (a) The CA levels of intestinal contents among the three groups (n=6~8). A, compared with control group, p<0.001; B, compared with HFD+FMT group, p=0.001. (b) The DCA levels of intestinal contents among the three groups (n=6~8). C, compared with control group, p<0.001; D, compared with HFD+FMT group, p=0.008.

