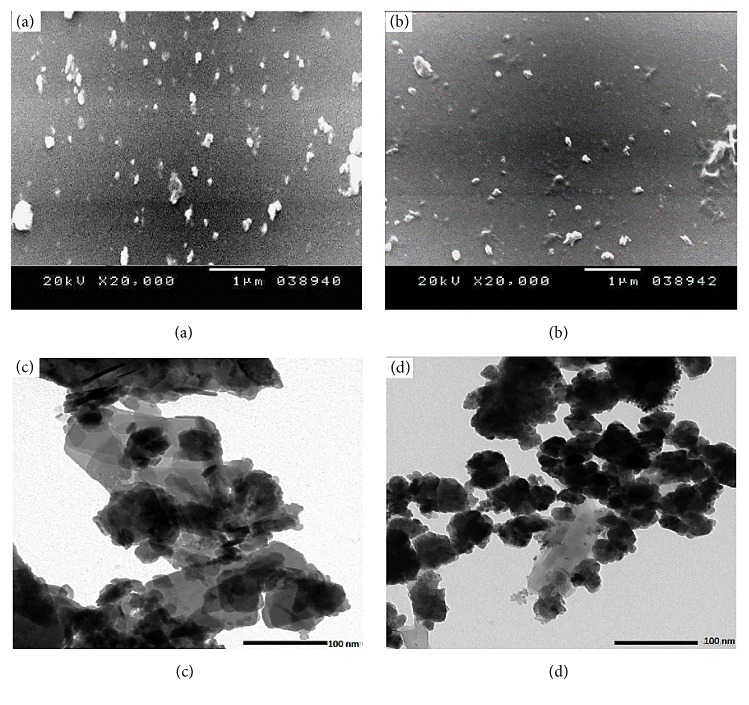
Figure 2.
Electron microscopy images of Ch-MO NPs. (a), (b) The SEM of Ch-CuO NPs and Ch-ZnO NPs, respectively. (c), (d) The TEM of Ch-CuO NPs and Ch-ZnO NPs, respectively. Scale bar for SEM measurements was 1 μm and magnification x20000 at 20 Kv. Scale bar for TEM measurements was 100 nm and magnification x40000 at 20 Kv.

