Figure 5.

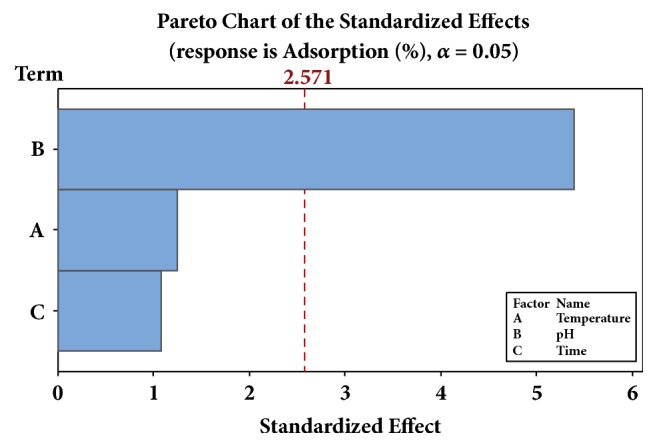
Pareto Chart of the standardized effects of pH, temperature, and time of adsorption (response is adsorption (%), α = 0.05).

Pareto Chart of the standardized effects of pH, temperature, and time of adsorption (response is adsorption (%), α = 0.05).