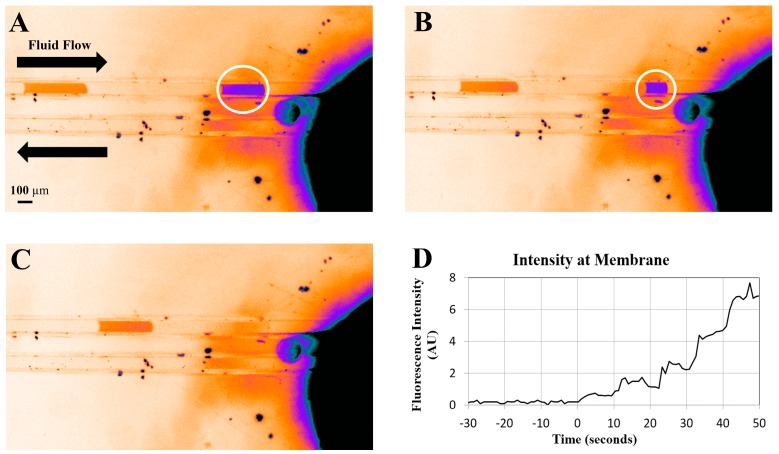
Figure 3.
(A–C) False colour images of droplets flowing into the membrane. The membrane appears black (high intensity) due to staining by rhodamine. Imperfect bonding near the membrane allows the droplet to leak out of the channel before contacting the membrane. (D) Total fluorescent intensity over the membrane versus time as rhodamine droplets are delivered. Approximately 5 nL droplets were formed at 10 s intervals. The intensity rises in nearly quantized steps every 10 s, clearly showing regular accumulation of dye at the membrane port while oil continued to flow to the output.

