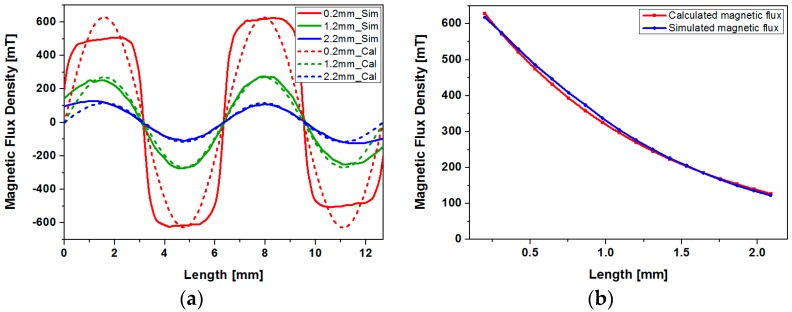
Figure 4.
Simulation and curve fitting results of the magnetic flux density at various gaps from the magnet: (a) magnetic flux along the x-axis at various gaps (solid line shows the simulation result and dashed line shows the magnetic field distribution represented with sine function); (b) maximum magnetic flux density at various gaps.

