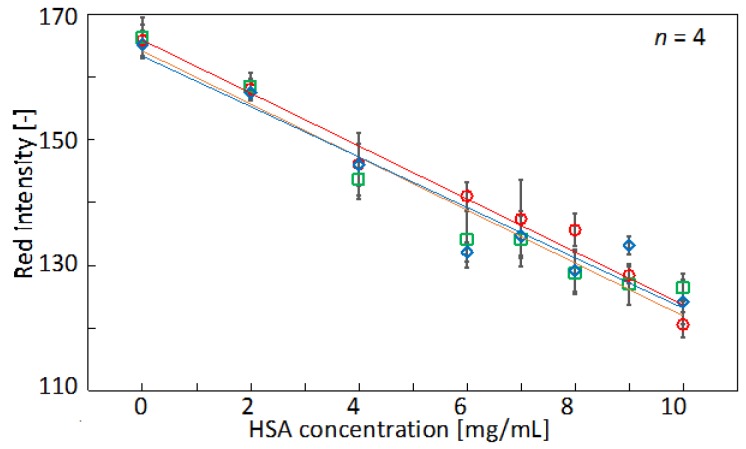
Figure 7.
Calibration curves for HSA obtained with variable sample volumes: 0.7 µL (red circles), 0.8 µL (green squares), and 0.9 µL (blue diamonds). Data plots and error bars represent mean red intensities and corresponding standard deviations extracted from four detection zones (parameters of regression lines shown in Table 4).

