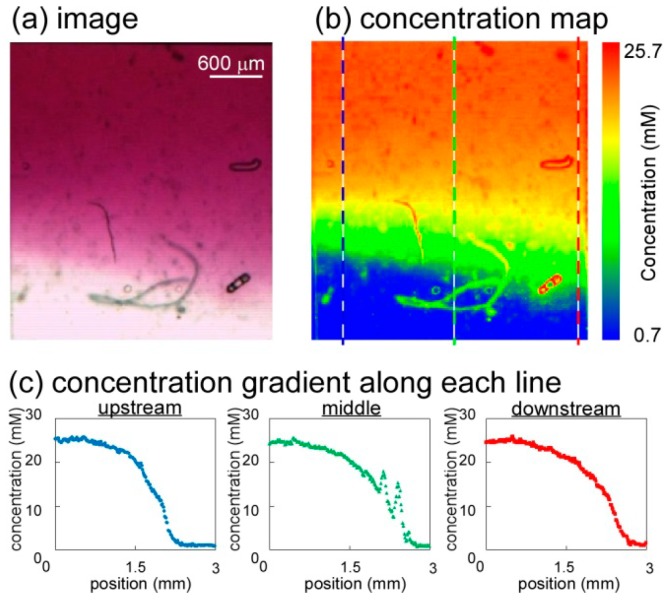
Figure 9.
Map of the dye concentration in a united cell culture microchamber. (a) Image of the cell culture microchamber during gradient generation by using Nile red dye; (b) Map of the concentration of Nile red dye in the microchamber. The diffusion coefficient of the dye is nearly the same as that of glucose, meaning that the concentration of the dye is an accurate proxy for that of the glucose concentration; (c) Plot of concentration gradient along each line of upstream, middle and downstream.

