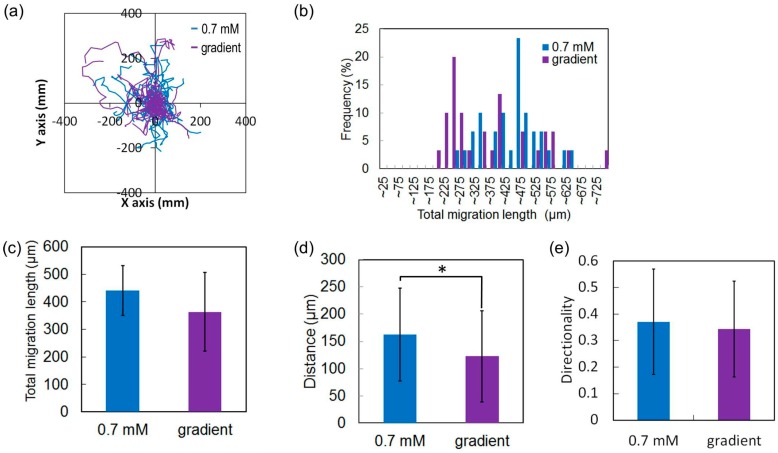
Figure 17.
Mobility of HeLa cells in uniform and low gradient concentrations of glucose over a period of 24 h. (a) Trajectories of HeLa cells; (b) Histogram of the total migration length; (c) Average total migration length; (d) Travel distance from the origin; (e) Directionality of HeLa cells along the y-axis. * p < 0.01 (t-test).

