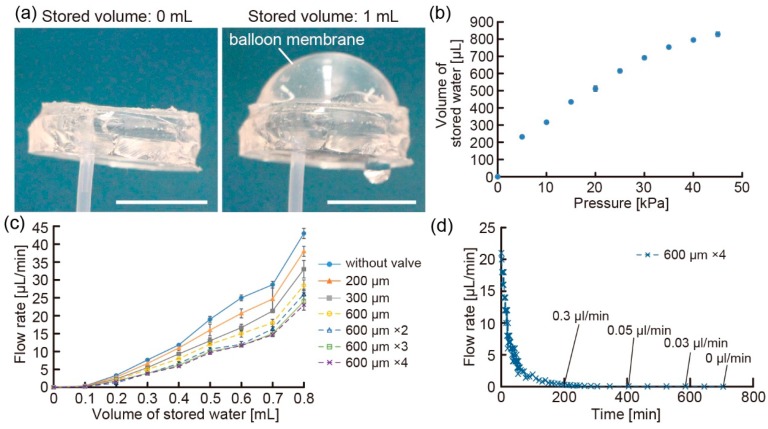
Figure 4.
(a) Images of the inflation of the balloon membrane when storing water (scale bars: 1 cm); (b) relationship between the maximum volume of stored water and the applied input pressure; (c,d) plots of the discharge flow rates for different floating valves according to the (c) volume of stored water and (d) time after the storage of 0.8 mL of water.

