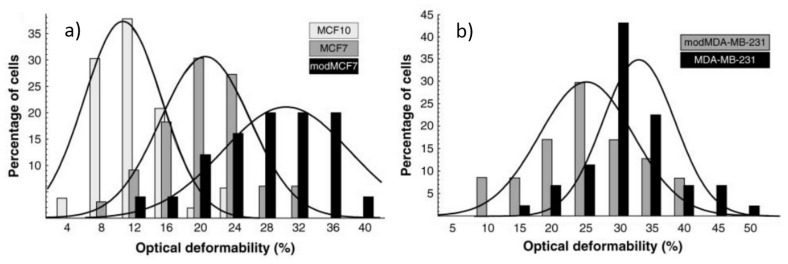
Figure 15.
Optical deformability of normal, cancerous, and metastatic breast epithelial cells. (a) The three populations of the MCF cell and (b) the two populations of the MDA-MB-231 cell are clearly distinguishable. Curves represent the fitting of normal distribution. Figure reproduced with permission from Reference [23] with permission from Prof. Guck.

