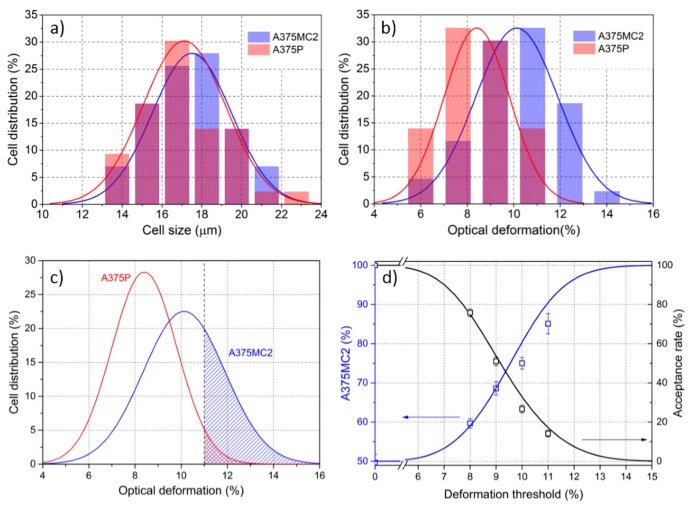
Figure 18.
Cell sorting efficiency check. Characterization of the cellular size (a) and optical deformability (b) of two cell lines, A375MC2 and A375P; (c) Normalized cellular distributions as a function of their optical deformations from experiment data in (b). The whole area under each cell curve is set equal representing the same concentration. By defining a deformation threshold, a sub-population of A375MC2 can be enriched by collecting cells with higher deformability; (d) The ratio of A375MC2 in the collected cell sample and the ratio of cells in the initial sample that are expected to exhibit deformability higher than the threshold (acceptance rate) versus the defined threshold value. Figure reproduced from Reference [24] with permission from Royal Society of Chemistry.

